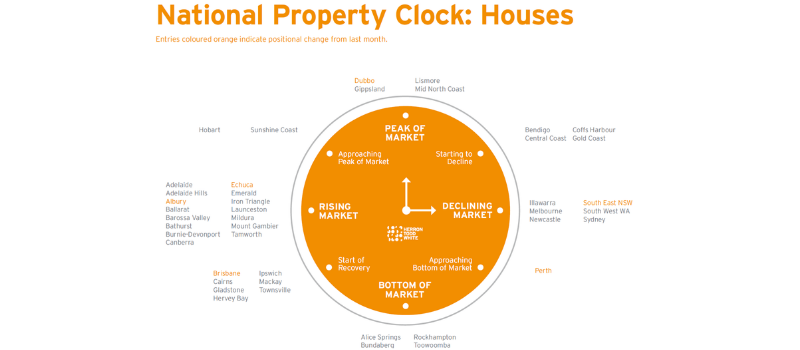
If you’re looking to buy or sell, the Herron Todd White (HTW) Residential Property Report is a great reference tool. Their property clock is a good visual representation of the state of the property market and its cycles. The March national property clocks for houses and units are included below, along with detail on how it works and to best use it.
What is the Property Clock and How Does It Work?
The property clock is a useful way of tracking the property market cycle, and whether or not it’s a good time to buy or sell. It is based on the recognised stages of the property cycle: a “boom” followed by a downswing in prices, “bust” as the market hits the bottom of the cycle, and then a recovery period as the market builds towards the next boom.

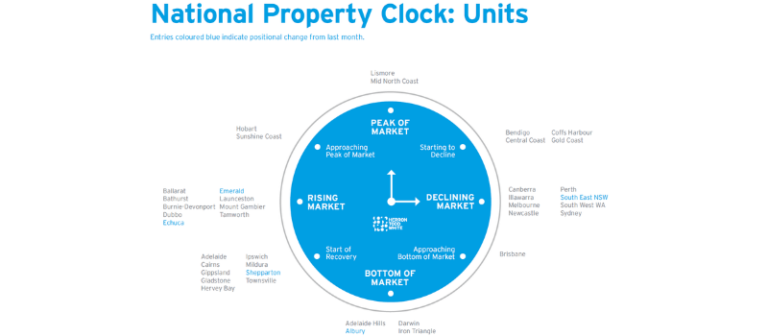
When the hour hand on the clock is at 12, the property market is at the top of a boom, demand is outpacing supply and prices are at their peak. As the hand moves down clockwise around the face, the market enters a downswing period and prices start to cool until, when the hand reaches 6, there is an oversupply of houses and the market bottoms out.
But then things start to turn around as the recovery period begins, where the hand moves further around the clock face and up towards 12, the next boom period once again.
Using the Property Clock
By working out where a suburb sits on the clock, you can time the market just right to get the best value for money: that is, selling at the peak and buying when prices are at their lowest.
The property clock can assist by helping you work out the best times to buy and sell and develop a safe and successful property investment strategy. For example, if a regional is sitting at 7 or 8 o’clock on the cycle, now could be the perfect time to buy, as while prices are still fairly low, there is the potential for a substantial upswing before the boom period. On the other hand, if a region sits at 12 o’clock, this is the worst time to buy, as prices are at their peak.
Your Location on the Property Clock
Accurately calculating just what “time” it is on the property clock in a region can be difficult. While there are well-established cycles in place, it’s rare that property prices will follow the exact path you predict.
Factors that influence the property market cycle can range from small local issues to developments on a global scale. For example, if the largest employer in a small town gets into financial difficulty and has to lay off a large portion of its workforce, you can expect the market to cool. On the other hand, if interest rates fall around the country, the more favourable borrowing conditions this leads to will cause increased housing demand that leads to a rise in prices.
You should also take note of the signs to look out for. For example, rising prices and auction clearance rates of more than 50% could indicate a rising market, while properties regularly selling for higher than the asking price and only being listed for a very short period could indicate that the market is at its peak.
You can create your own version of the property clock by looking at property market data available from providers like APM Monitors and RP Data, or even Domain and realestate.com.au.
Alternatively, you can access regular property clock updates from Herron Todd White, Australia’s largest independent property valuation and advisory group.
Property Clock Constraints
While the property clock is useful for home buyers and investors, the fact that it is used to predict the future, means there’s always a risk of unexpected economic or market developments in the property cycle.
The property clock can also cause some investors to take too much of a short-term view on property investing and makes it easy to forget about the long-term benefits an investment property portfolio can generate.
No matter what stage of the cycle the market is at, it’s still possible to make money in real estate. You just need to know what you’re doing and where to invest your money.
Find Out How Your Suburb is Performing
For more detail on how your suburb is performing, you can download the full HTW report here.